
Background
PI Vision provides an intuitive and friendly method of visualizing operational data in the PI system. It is the flagship application from AVEVA for web and mobile-friendly data visualization. The web application provides the ability to visualize data using symbols which can be dragged and dropped onto screens and bound to data items in PI Data Archive or PI Asset Framework.
The application also provides an extensibility platform as user-defined custom symbols can be added to the web application allowing representation of the data in additional ways beyond what is provided out of the box. MetaFactor can help develop custom symbols for your organization – please contact us to learn more.
What’s Provided Out-Of-The-Box
Out-of-the-box PI Vision provides the following symbols:
- Trend – a line graph which shows the values of one or more data items plotted against time.
- Value – shows value of a data item, as of the end time on the trend.
- Table – displays one or more data items in a tabular format; can display additional metadata such as descriptions, units, and trending sparklines as well.
- Gauges – provides a graphical view of a value reading at the end time of a display; helps determine whether values are in an acceptable range by providing a visual. Can be radial, horizontal, or vertical.
- Bar Chart – allows comparison of multiple values through a graphical representation of bars.
- XY Plot – XY plots correlate one or more X-axis data sources with one or more Y-axis data sources.
- Asset Comparison Table – asset comparison tables compare measurements and other process information by showing a row per asset and columns to depict asset attribute data.
- Events Table – shows a table of event frames and associated attributes related to elements.
Limitations of Available Symbols
Although robust and easy to use, available symbols have several key limitations:
- Manual Data Entry – manual data entry is often needed. End users often do not need all the bells and whistles of an operator rounds data logging solution and just want a place to be able to insert a few values into PI. This is a key lacking feature of PI Vision.
- Additional Metadata – including additional contextual information such as tag names when symbols are mapped to PI AF attribute paths, or other related information.
- Tabular Data – the tabular symbols fit most use cases but there are certain limitations that affect various scenarios. For example, there are limitations in customizing table columns to include additional metadata fields, or customizing formatting.
- Additional Visuals – additional types of visuals such as pie charts, histograms, or 3D charts are not available. Symbols to represent audio and video are also unavailable.
There are several other scenarios which warrant customization but the above are some of the more common pain points. Symbols can also extend the functionality to additional non-core use cases, such as:
- Integrating with third-party or internal web services or applications
- Providing ability to extract or export data.
- GIS capabilities including the ability to incorporate with mapping services.
PI Vision Custom Symbols
The following are some of the custom symbols MetaFactor has developed. These are available for purchase as well:
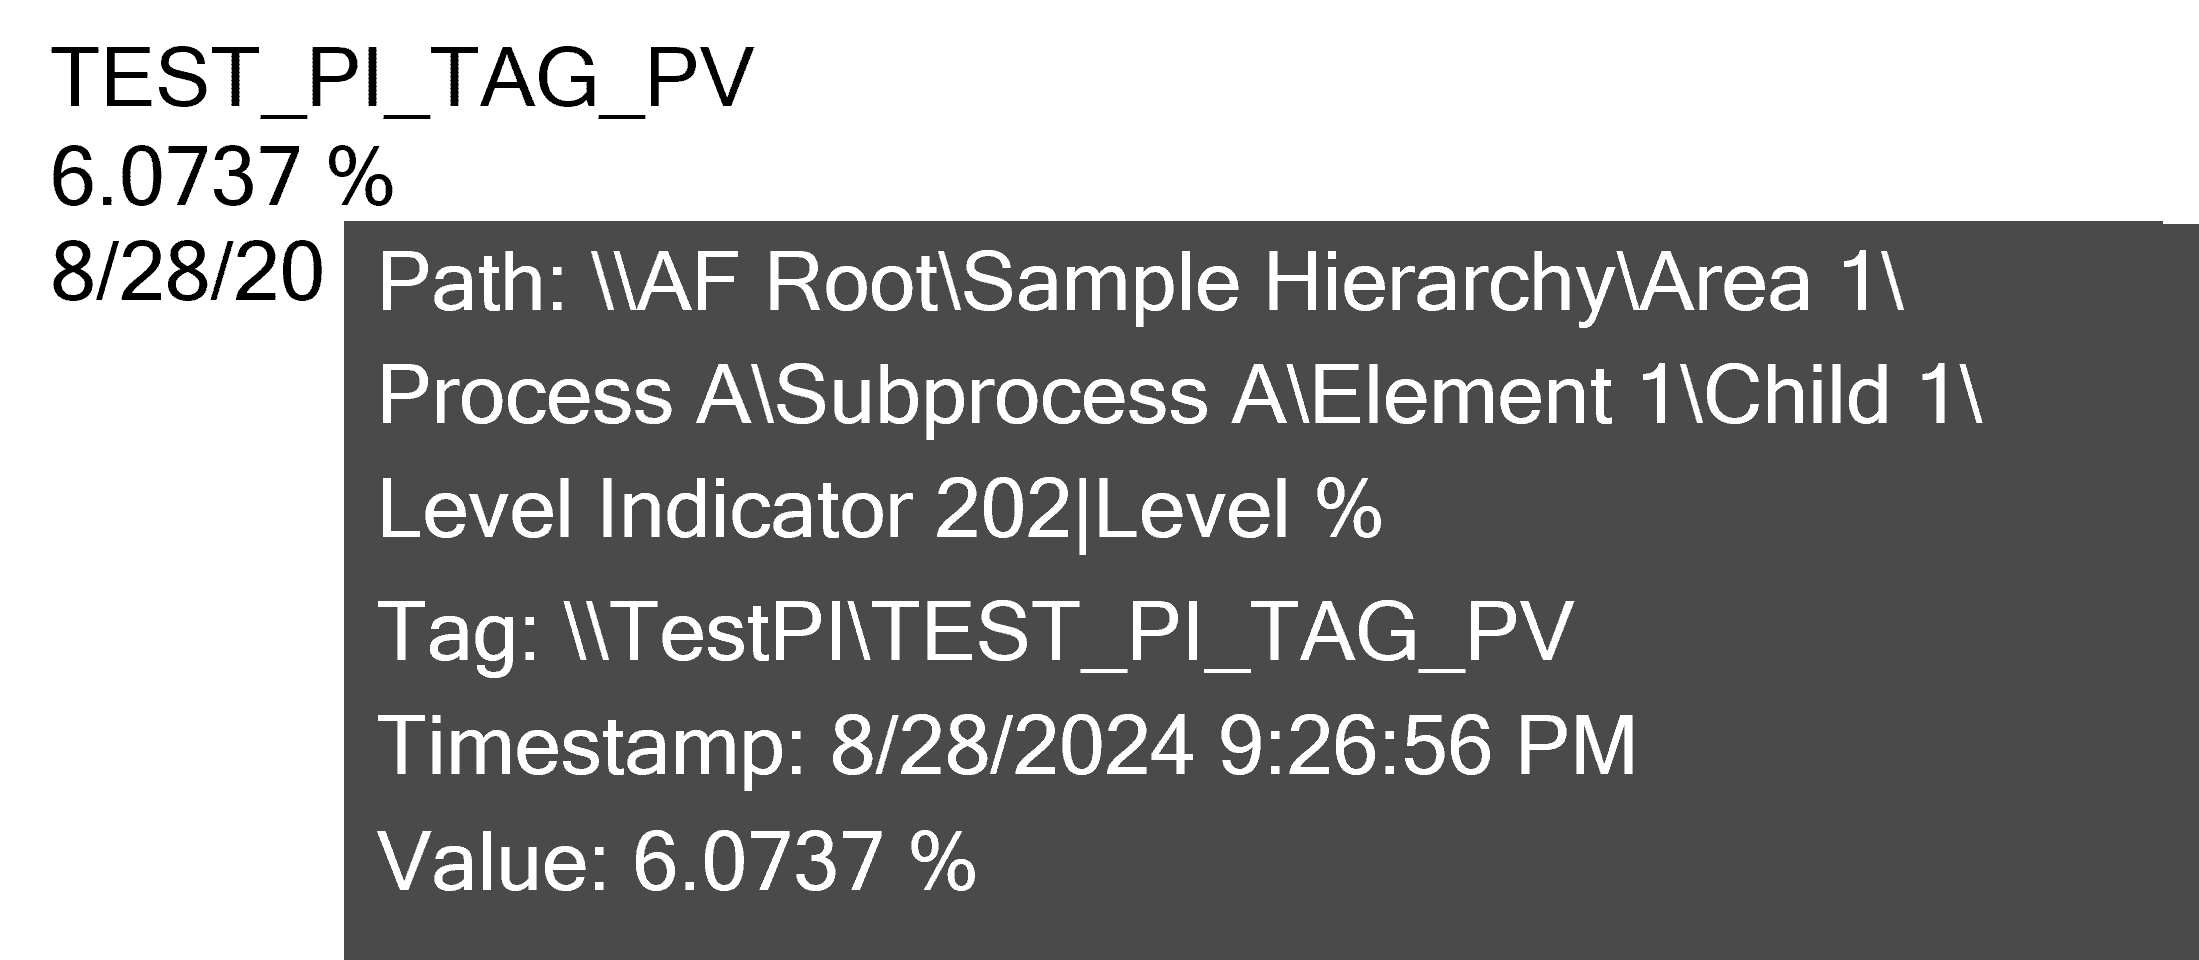
- Advanced Value with Tag Metadata – engineers using PI Vision screens often complain about not knowing the tag name mapped to AF symbols. The Advanced Value symbol allows the tag name to be displayed in a label or as a tooltip without any extra configuration.
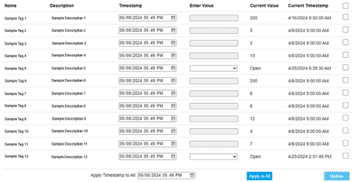
- Manual Data Entry – manual data entry table allowing writes to PI tags and AF attributes at the current or a fixed time. It supports entry for one or more attributes. Basic data validation is also provided for required entries.
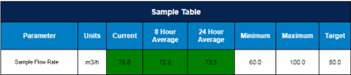
- Custom Table – table with customizable columns based on AF attributes. Columns including minimum, maximum, target, description, underlying tag name can be displayed, along with optional conditional formatting of values. Many rows can be displayed based on parameters and attributes selected. All numeric columns can be edited as well as this symbol supports manual data entry as well.
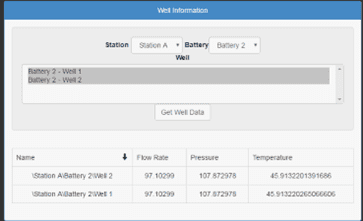
- Well Data – MetaFactor can help build custom symbols to support different user workflows and this is one such example. The symbol below allows filtering of the hierarchy based on two related drop-down lists and shows relevant data based on further user selection. This provides rich and customized interactive functionality for end users.
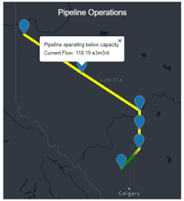
- Maps – Third-party mapping services such as Google or Bing maps can be connected to, layering on pushpins and additional formatting, annotations, and logic. This is an example of a custom symbol that connects to PI AF and displays operational data overlayed onto a map using Bing Maps.
We Can Help
MetaFactor has strong expertise in this area and can help develop a custom symbol for your organization. If you have a symbol but would like to enhance or troubleshoot it, we can also help. If you are interested in learning more about our capabilities or would like to inquire more about the custom symbols available please reach out to us.